Generate h5ad files for embedding datatype and cellxgene browser
Generate h5ad files for embedding datatype and cellxgene browser
The h5ad files are composed of a cell by feature (e.g. gene, peak) matrix, metadata such as cluster labels for barcodes, and the embeddings (e.g., tSNE, UMAP, PCA).
R objects from seurat/bioconductor to h5ad file using Seurat conversion tools & Sceasy
$conda activate my_env
$R

>lung <- readRDS("./snRNA_lung.rds")

>library(Seurat)

>library(reticulate)

>library(sceasy)

>use_condaenv("my_env", required = TRUE)

>sceasy::convertFormat(lung,from = "seurat",to = "anndata", outFile = "snRNAlung.h5ad")
Create h5ad using matrix, metadata and embedding files using scanpy.read_mtx which will result in an anndata file (that can be written to .h5ad)
>>>import scanpy as sc>>>import pandas as pd>>>adata = sc.read_mtx("/home/ubuntu/matrix.mtx")>>>adata.obs = pd.read_csv("/home/ubuntu/meta.csv")>>>embeddings = pd.read_csv("/home/ubuntu/UMAP_coordinates.coords.csv")>>>embeddings = embeddings.to_numpy()>>>adata.obsm["X_umap"] = embeddingsWriting h5ad output
>>>data.write("/home/ubuntu/snatac.h5ad")
Use case
>>>import scanpy as sc>>>import pandas as pdStep2 - Read matrix market format
Sample matrix file
%%MatrixMarket matrix coordinate integer general
%
27605 35067 61017931
1 1 1
2 1 1
3 1 1
adata = sc.read_mtx("/cmdga/RNA.matrix.mtx")
Step 3 - Read metadata
Sample metadata file is in csv format with barcode & metadata such as celltype, compartment, sample, condition, age, sex etc.
 cluster_name,subject
Type II muscle fibers,KSM1
Type II muscle fibers,KSM1
Type I muscle fibers,KSM1
Type II muscle fibers,KSM1
>>>adata.obs = pd.read_csv("/cmdga/metadata.csv")
Step 4 - Read embedding file
dim1,dim2
1.06232331651473,-2.53162407670363
4.03972034114623,-6.998375175336442
0.684326096952196,7.868162395616928
0.6370403315427271,-4.30017423425063
-7.71711511951661,4.6345155259575
>>>embeddings = pd.read_csv("/cmdga/RNA.umap.csv")>>>embeddings = embeddings.to_numpy()>>>adata.obsm["X_umap"] = embeddingsStep 6 Writing h5ad output
>>>data.write("/cmdga/snrna_muscle.h5ad)Visualization of h5ad files on cellxgene browser
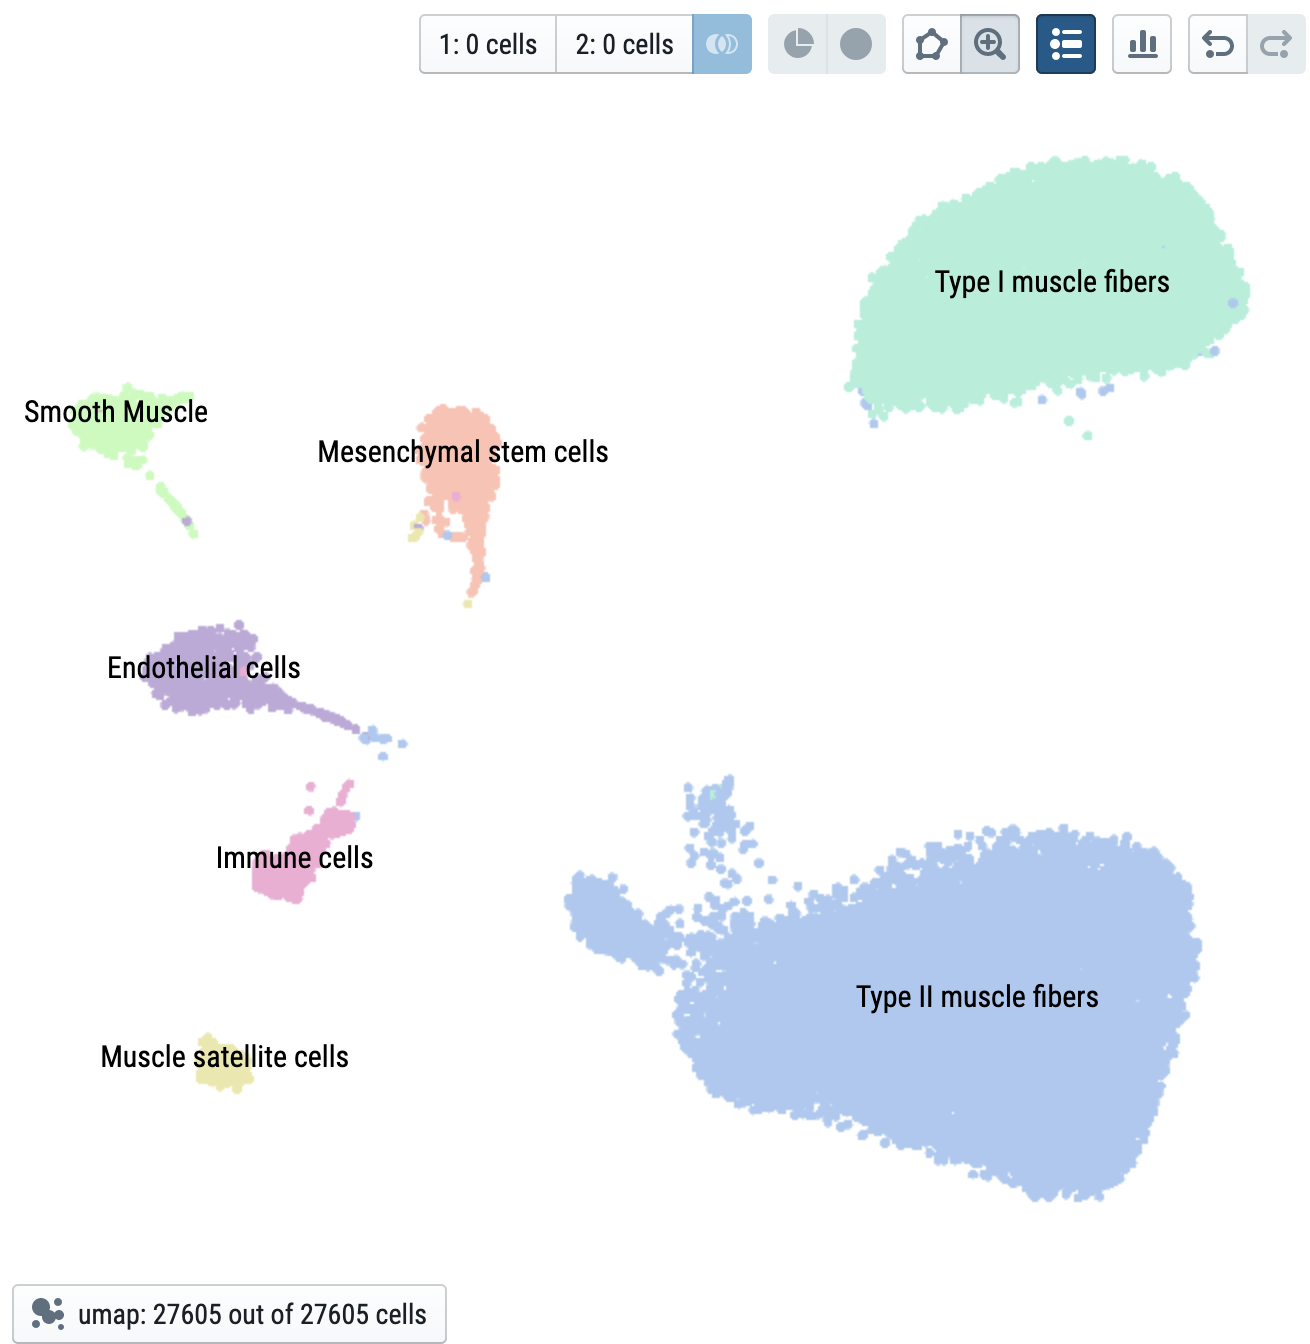
Data structure: anndata fields used for visualization
Expression data
Gene expression values are pulled from anndata.X. These feed into the histograms, scatterplot, colorscale, and differential expression calculations.
Metadata
Categorical (e.g., cluster labels) and continuous (e.g., pseudotime) metadata are pulled from anndata.obs. Any column added here will be available for visualization in cellxgene.
Embeddings
cellxgene looks for embeddings (e.g., tSNE, UMAP, PCA, spatial coordinates) in anndata.obsm. These fields must follow the scanpy convention of starting with X_, e.g., anndata.obsm['X_umap']. If an embedding has more than two components, the first two will be used for visualization.