Getting Started
The Common Metabolic Diseases Genome Atlas (CMDGA) provides epigenomic and other functional genomic data to promote understanding of the underlying genetic basis of common metabolic diseases. CMDGA is developed at the University of California San Diego as part of the AMP®-CMD consortium of academic, industry and non-profit institutions worldwide.
This document describes the data available in the portal and how to access and download them.
If you have any inquiries regarding the data in the Common Metabolic Diseases Genome Atlas, please feel free to contact the team via email.
Information available on the portal
The portal consists of functional genomics data from tissues and cells relevant to common metabolic diseases, including:
- Metadata, raw and processed data files for experimental assays
- Metadata and data files for annotations
- Metadata and data files for single cell embeddings
- Metadata and data files for gene perturbation datasets
- Metadata and data files for statistical models
- Detailed pipelines and software used to process datasets
The information and data in the portal can be accessed by:
- The Search Tools on the Homepage and menus of the portal for browsing experimental assays, annotations, and raw and processed data files
- The Single cell browser displays cell embeddings in two dimensions based on their gene expression or accessible chromatin profiles, using the cellxgene software
Explore the Portal and Tools
Datasets can be explored with data specific Search Tools on the homepage or viewed as a user-friendly matrix that is accessible through the Data menu
Data types:
Experiments: Molecular assays generated by a research group. Experiments can be filtered by the following categories on the left sidebar of the experiments page: assay category, assay, experiment status, target of assay, lab, and replication type.
Annotations: analytical distillations of experimental data generated by software tools. Annotations can be filtered by annotation type, underlying assay, biosample and lab.
Single cell embeddings: genomic profiles of individual cells derived from multiple experiments used to visualize single cells in reduced dimension space and facilitate analyses of single cell profiles in common software packages. The h5ad files are composed of a cell by feature (e.g. gene, peak) matrix, metadata such as cluster labels for barcodes, and the embeddings (e.g., tSNE, UMAP, PCA). Embeddings can be filtered by embedding type, biosample, lab, and underlying assay.
Gene perturbations: manipulations of genes in cell or animal models for example using siRNA/shRNA, CRISPR editing or expression vectors. Gene perturbation studies in CMDGA can be filtered by type, assay throughput, target of assay, and biosample.
Statistical models: statistical models, for example PyTorch for machine learning models, which can be used to model functional genomics data.
Single Cell Browser
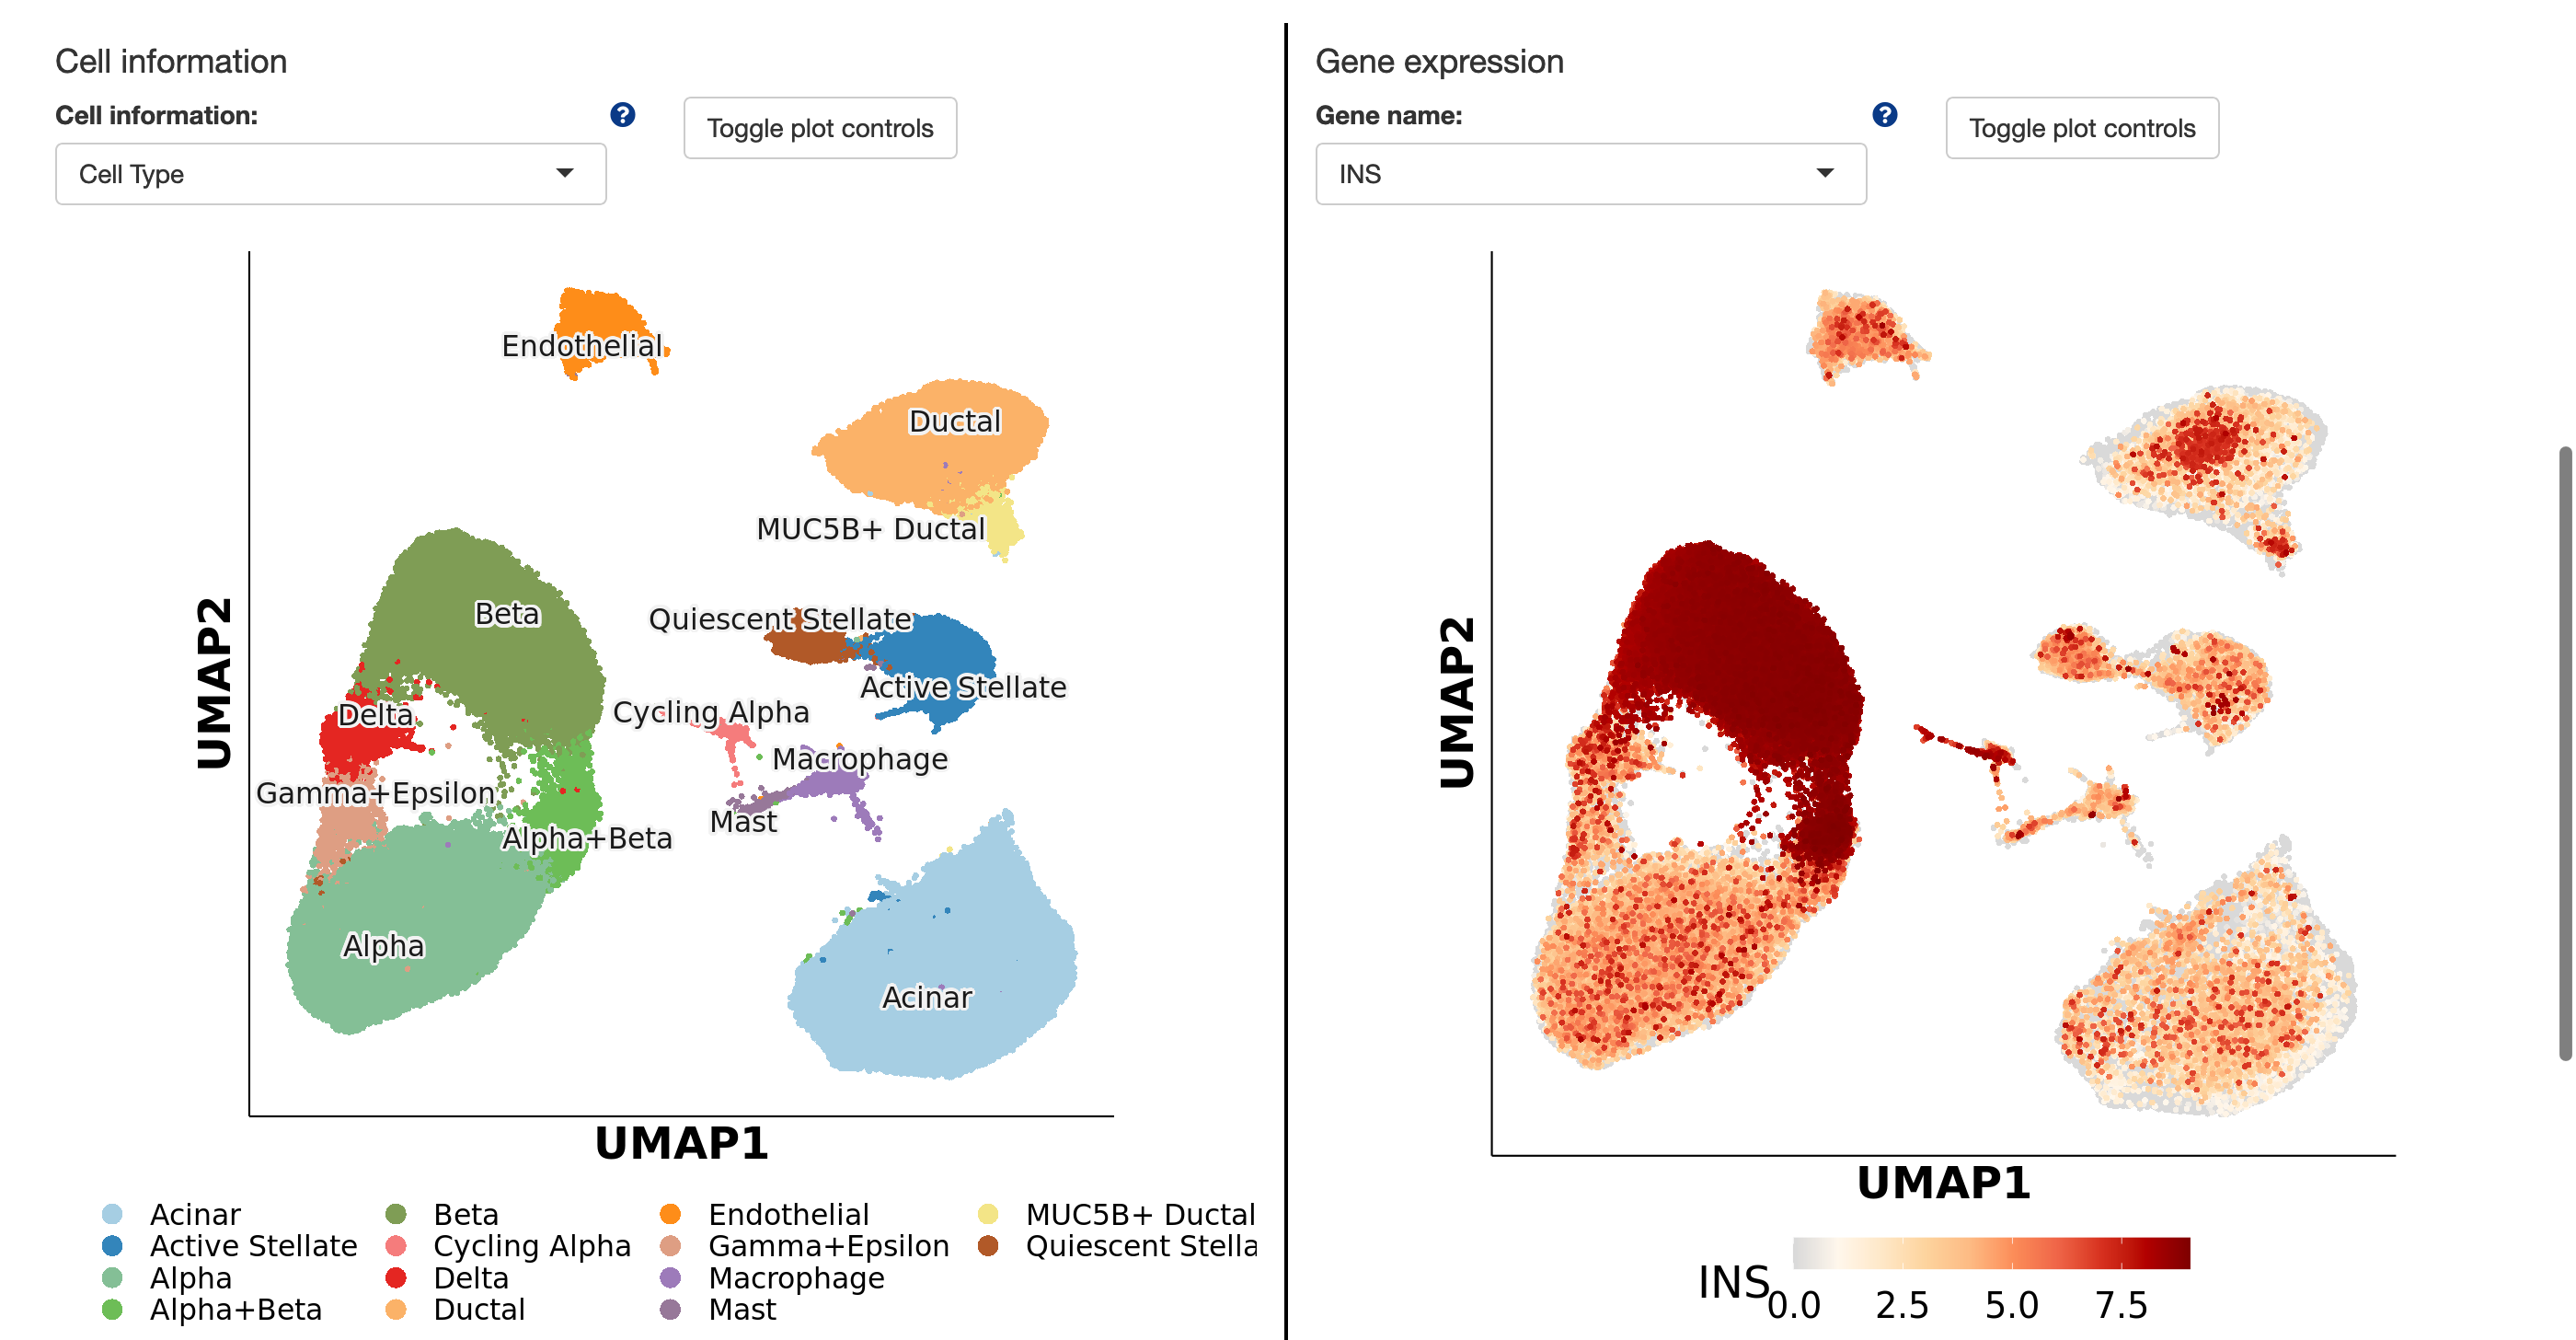
The Single Cell Browser (shiny app) is a tool with seven tabs for visualizing different data aspects. The first tab shows a UMAP plot of cell information and gene expression. There's a toggle to show cell counts per cluster or gene. The next tabs compare cell information and gene expressions side-by-side. The fourth tab shows a coexpression plot for two genes. The fifth tab displays cell information or gene expression distribution across clusters with violin or box plots. The sixth tab visualizes cell cluster composition with proportion plots. Lastly, the seventh tab uses bubble plots or heatmaps to show multiple genes' expression across clusters, with an option for hierarchical clustering.
Other resources
Diabetes Epigenome Atlas (DGA) and T2D Knowledge Portal
View the video from September 26, 2019 webinar: Diabetes Epigenome Atlas (DGA) and T2D Knowledge Portal: connected and complementary resources for research on the genomic and genetic basis of T2D.
Ontologies
The following ontologies are used for metadata: